Quote:
Originally Posted by Dharrisoncmo@gmail.com

Yes, a similar curve. But the Y-Axis can be misleading. The range goes from 1 death per to 10! THAT IS A HUGE DIFFERENCE. So, the graph is interesting - but the conclusion drawn from is not accurate.
|
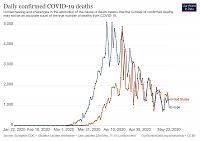
I used that graph because it adjusted for population in countries. Here is another graph plotting daily total confirmed deaths in USA vs Europe. Europe has more people than us and peaked earlier, but you see the same shape in the curves over the same period of time. Deaths rise quickly and then taper off. Doesn't change my conclusion that something unknown is at work here at all.