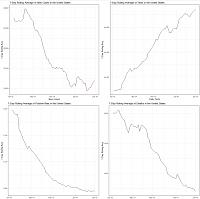
As these graphs from Sean Trende of Real Clear Politics show, there is no second wave of coronavirus happening. There have been some spikes in a few places, but overall the trends look very good. 70% of the spike in Florida is located in 6-7 counties. These graphs show national data. The only one going up is testing.
Upper left graph = rolling average of new case
Upper right graph = rolling average of tests
Lower left graph = rolling average positive test rate
Lower right graph = rolling average of deaths